Distributions and Error
The sampling distributions that we used to test our hypothesis are shown below. This time, we have labeled each of our possible outcomes.
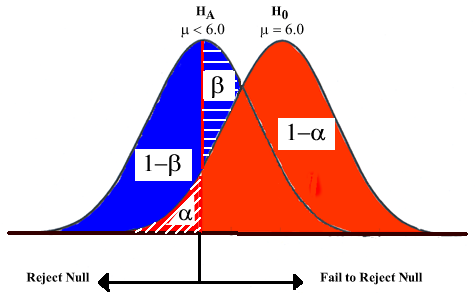
Let's make sure we understand this.
The "red" distribution is the sampling distribution we would obtain if the null hypothesis was true. This shows the values of sample means we would expect if technology had no impact on face-to-face social interaction. If we failed to reject the null hypothesis (our sample mean was not extreme), then we would have made the correct decision which is represented by the solid red portion and is labeled "1-a". If, in fact we had obtained an extreme mean that fell in the red striped portion of the sampling distribution, then we would reject the null hypothesis. We would have made a Type I error (rejecting the null when it is true). This section is labeled "a".
The "blue" distribution is the sampling distribution we would obtain if the null hypothesis was false. This shows the values of sample means we would expect if technology reduced face-to-face social interaction. If we failed to reject the null hypothesis (our sample mean was not extreme), then we would have made a Type II error (failing to reject the null when it is false). This is represented by the blue striped portion of the sampling distribution and is labeled "b". If we had a sample mean that fell in the region marked by the solid red line (rejection region), then we would have made the correct decision to reject the null hypothesis. Correctly rejecting a false null is represented by the solid blue portion of the distribution and is labeled "1-b".
Now we are ready to introduce the concept of statistical power -- the probability of correctly rejecting a false null hypothesis.