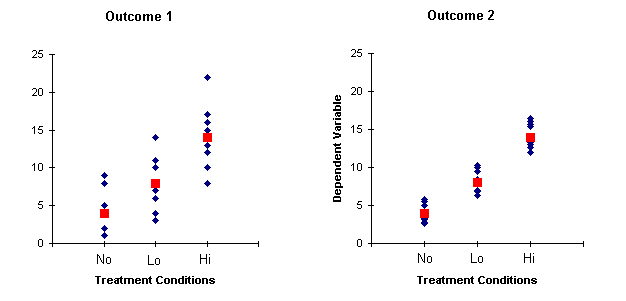

Above are two possible outcomes of an experiment testing different intensities of behavior therapy for autistic behavior. The treatment conditions are No Treatment, Low-Intensity Treatment, and High-Intensity Treatment. The ordinate represents treatment outcome, such that higher scores on the dependent variable indicate better outcomes. Individual-subject scores are represented by blue diamonds; mean scores within treatment conditions are represented by red squares. The means are the same for Outcomes 1 and 2. Which of these outcomes is more convincing in terms of showing genuine treatment effects?
Below are the data from the two outcomes.

Do the following calculations by hand and using SPSS.
1. For each outcome, calculate the mean of the variances within treatment groups. In other words, calculate the variance of the scores in the No group, the variance of the scores in Low group, and the variance of the scores in the High group, and then average them.
2. For each outcome, calculate the variance of the means of the treatment groups, i.e., calculate the variance of the three means as if they were raw scores.
3. Compare the two quantities you calculated for each outcome. How do they bear on your answer to the question in italics above?
: This is just an illustrative exercise; you do not in fact calculate ANOVAs this way!
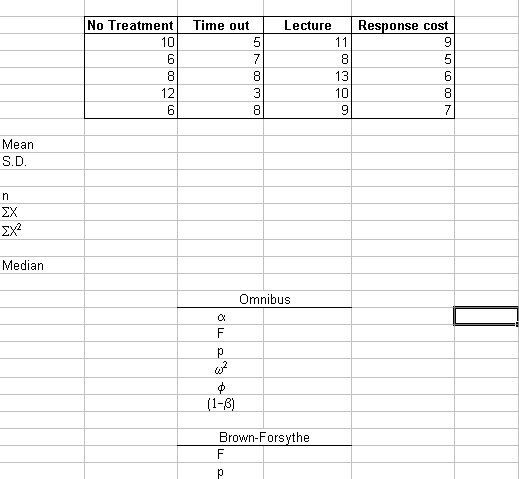
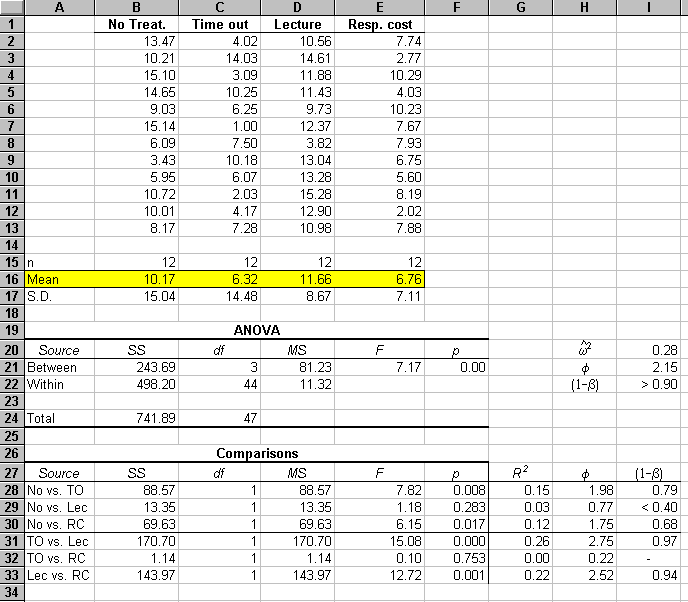
Below is the data set we began talking about in class. Do the ANOVA, calculate the effect size and the power of the test, and test for homogeneity of variance. (In the Omnibus list below, omega squared should be omega-hat squared.)


Although you can obtain power estimates from Table 8. 1 (p. 173) and from the modified Pearson-Hartley charts that appear as Appendix A.7 in your textbook, you may find it more satisfactory to calculate power directly using computer software. A quaint, free, and perfectly serviceable program is G*Power, written by the German psychologists, Axel Buchner, Edgar Erdfelder, and Franz Faul. Download the version for Windows (which is actually an MS-DOS program that runs on the Windows OS--hence the "quaint" descriptor), save the file to your hard drive and then double-click it to install G*Power on your computer. The authors provide some help using the program.
Two important points when using G*Power for ANOVAs:
1. G*Power uses Cohen's f to represent effect size (for ANOVAs). We have been using w-squared. The two are related as
![]()
for the population parameters, and
![]()
for their estimates.
2. "Total sample size" in G*Power is an, the total number of subjects in the ENTIRE experiment. It is NOT n, the number of subjects in each group.
Click your browser's back button to return to the home page.